
Vision Zero Update - January 2026
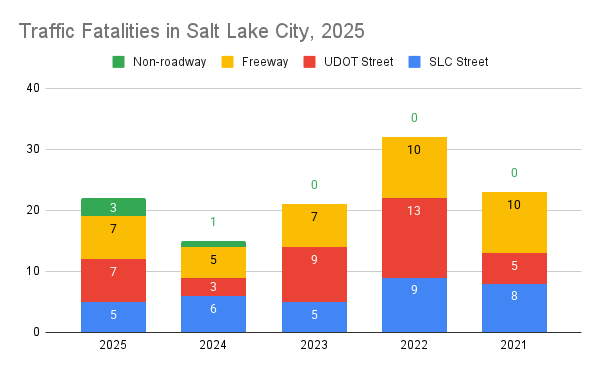
With 2025 wrapped up, we wanted to take a look at how Vision Zero is going in Salt Lake City. We rely on data from the Utah Department of Public Safety and our traffic violence map for 2021-2025, and use our map to attribute where the fatality occurred. On SLC owned streets, 2025 is similar to 2024 and 2023, with 5 deaths on these streets. Meanwhile adding UDOT streets more than doubles the number of deaths, adding 7 more.
Overall, we’re seeing SLC streets hold with lower fatalities the past three years and UDOT streets remaining more deadly — clearly there is much more work to do. And as we’ve pointed out in the past, a handful of UDOT streets have accounted for more deaths in the past 5 years than all of SLC’s local streets combined.
We don’t have a complete picture of serious injuries due to more limited information, but SLC’s Vision Zero Dashboard shows all non-freeway serious injuries. They haven’t released 2025 data yet, but the previous 3 years were lower than the 17 year average (2008-2024), and we hope that trend has continued.
SLC is to release the draft of their Safe Streets Action Plan this March, so we hope to see SLC target the small percentage of streets that contribute the most to traffic violence. We’ve already seen some action on this through last year’s Capital Improvement Program funding, which allocated $2.3 million for “Vision Zero Corridors & Safety Improvements” to Redwood Road, 900 West, and 800 South. We hope to see movement on these dangerous streets soon.
Note: our traffic violence map data is reconciled with reports from SLCPD, though their list can include non-traffic fatalities like industrial accidents and we remove those. We also look for associated news articles, though not all fatalities are reported on or contain enough information. We assume that other fatalities that appear in the Utah DPS count are freeway crashes, since us and SLCPD do not include freeways in our counts. We do our best to represent the data accurately but cannot guarantee the attribution of the crashes or the accuracy beyond what is reported to us.
We’re also adding a ‘non-roadway’ category. These are crashes that are associated with the lethality of the car, not the street design. Many of these occurred in parking areas and driveways and are due to the weight and limited visibility of vehicles. These are still traffic violence, but we separated these out in order to evaluate street design. With that said, planning and zoning can play roles here in terms of driveway and parking design!
To achieve Vision Zero, all stakeholders must do their part. Death isn’t inevitable on our streets, it’s a policy choice.